Category: Uncategorized

  • Primary care must lead care coordination

    We assert the role of primary care providers to lead care coordination.

    The Association of Family Health Teams of Ontario (AFHTO) endorses and embraces this position statement adopted with our colleagues in the Ontario Primary Care Council in November 2015.  Primary care providers work to ensure access to interprofessional care for patients and identify a single point of contact to help patients and families navigate and access programs and services. Furthermore, AFHTO implores the Ministry of Health and Long-Term Care to work with primary care teams and LHINs to bring greater efficiency and patient-centredness to care delivery, through steps to transition care coordination resources to primary care teams from community care access centres (CCACs). Primary care is an anchor for patients and families, providing comprehensive care throughout their lives. Primary care providers are the first contact or entry into the system for all new needs and problems, and they directly influence the responses of people to their health needs by listening to their concerns and preferences and providing clinical evidence-based assessment and treatment recommendations. Care coordination in primary care has the potential to significantly:

    • Reduce the duplication and role conflict that currently exists in our health system;
    • Improve patient outcomes through much greater continuity and coordination of person-centred care.

    Click to read AFHTO’s position statement: Transitioning care coordination resources to primary care. Primary care teams want to coordinate care for their patients – this was clearly demonstrated by the 200+ leaders who participated in AFHTO’s October 2015 session on Leading Primary Care through the Next Stage. Through their work in Health Links, many primary care teams have demonstrated readiness to take on this role, and their success when they can mobilize the resources to fulfill this role. The transition of care coordination resources from CCACs to primary care teams is the logical next step.

    Resources for AFHTO members:

    Evidence and background on care coordination in Ontario:

  • Interested in serving on the AFHTO Board of Directors? Apply by July 5, 2016

    Dear AFHTO members: Primary care is evolving in our province; government’s Patients First proposal is pointing to significant change. It is a VERY interesting time to be serving on the AFHTO board of directors! To maintain balanced representation on the board, priority consideration will be given to candidates who are:

    • Physicians (Executive Directors and Interprofessional Health Providers are also welcome to apply)
    • From AFHTO members located in the eastern and northern regions of Ontario

    Four positions are to be elected for a 3-year term on the 14-member AFHTO board. The AFHTO by-laws call for balanced representation on the board to include the various forms of governance, the regions of the province, and the mix of the professions working within FHTs, NPLCs and other interprofessional models of primary care. The Governance Committee of AFHTO’s board invites anyone who works within an AFHTO member organization to apply by July 5th. Please share this call for nominations with all who work in your team. To apply:

    The Governance Committee of the AFHTO board will review all applications to assist the AFHTO board to determine the slate of candidates to recommend to the AFHTO membership for election at the AFHTO annual general meeting.

    • Nominees will be informed of their status by September 21.
    • Nominees who are not recommended for the slate will have until September 26 to determine whether they wish to proceed with having their name go forward on the election ballot.
    • The election will take place at the Annual General Meeting in conjunction with the AFHTO annual conference.  This year it will be held:

    Monday, October 17, 2016 8:30 AM – 9:30 AM The Westin Harbour Castle 1 Harbour Square Toronto, Ontario M5J 1A6

    Sincerely, Veronica Asgary-Eden Chair, Governance Committee AFHTO Board of Directors Clinical Psychologist, Family First Family Health Team

  • Governance For Quality Training

    The presentation slide decks for the Effective Governance for Quality in Primary Care Workshops, updated for 2016, are now available. To access them, see the links below (note: the workshop has 8 modules, each with a separate slide deck).

    What is Effective Governance for Quality in Primary Care?

    Effective Governance for Quality in Primary Care  is an evidence-based training program for FHT and NPLC Boards of Directors, Executive Directors and Medical Leads, . developed in partnership with the Canadian Patient Safety Institute (CPSI) and is delivered by peer leaders. To support the quality agenda in primary care, the Ministry of Health and Long Term Care (MOHLTC) partnered with CPSI, the Association of Family Health Teams of Ontario (AFHTO), the Association of Ontario Health Centres (AOHC), and the Nurse Practitioners Association of Ontario (NPAO) to customize CPSI’s Effective Governance for Quality and Patient Safety to Ontario’s primary care organizations. Effective Governance for Quality in Primary Care materials are updated regularly. Workshops are occasionally offered in Toronto and at various places around the province. Each workshop contains information to help Board members, Executive Directors and Medical Leads guide their organization in delivering quality primary care through good governance. Presentations from the session guide participants through exercises, case studies and best practices on how to lead, govern and improve organizations focused on quality. Please contact us to learn more.

    Workshop Slides:


    Workshop Handouts:


  • YOUR vote is in! Updates for the Data Dictionary for D2D 4.0

    Thank you to the more than 240 members from at least 75 teams who turned out for the survey about changes for D2D 4.0.

    As you overwhelmingly requested, most of the indicators ARE NOT CHANGING.

    See table below for the list of what is the same and what is new and improved!

    Data Source Indicator Status
    EMR Follow-up after hospitalization New
    EMR Diabetes Management Indicator Expanded (see below)
    EMR EMR Data Quality Expanded (see below)
    Patient Experience Survey Patient involved in decisions No change
    Patient Experience Survey Courtesy of office staff No change
    Patient Experience Survey Reasonable wait for appt. No change
    Patient Experience Survey Same/next day appointment No change
    HQO PCPR Cost No change
    HQO PCPR Patients rostered No change
    HQO PCPR SAMI No change
    HQO PCPR Readmissions to hospital No change
    HQO PCPR Regular primary care provider – individual No change
    HQO PCPR Regular primary care provider – team No change
    HQO PCPR Colorectal Cancer screening No change
    HQO PCPR Cervical Cancer screening No change
    EMR Childhood immunizations – all No change
    EMR Patients Served No change

    New and improved! Changes coming for D2D 4.0 are as follows:

    • Follow-up after hospitalization: a new indicator tracking follow up will be included: %  of patients for whom timely (within 48 hours) discharge notification was received (any condition) and had a follow up (by any mode, any clinician) within 7 days of discharge.
    • Diabetes management indicator: the current set of diabetes management measures (frequency and results of hba1c testing, blood pressure levels) is being expanded to include an indicator of cholesterol management: % of people with diabetes with a recent cholesterol (LDL) level of ≥ 2.0 mmol/L who are on statins.
    • EMR Data Quality: The current set of data quality measures (i.e. match between EMR and CCO rates for cervical and colorectal cancer and completeness of smoking status info) is being expanded to include a measure of clinical data consistency: % of patients with diabetes who have a diagnostic code for diabetes in the appropriate place in their record.
    • Time spent delivering primary care: More discussion is underway to improve data quality and relevance of this information for D2D 4.0. Stay tuned for more information.

    Further details for these and other indicators will be available in the D2D 4.0 Data Dictionary coming out at the end of June 2016.  The dictionary will be pre-released to QIDS Specialists for comment earlier in June for one last chance to include their advice for the final version.

    Reminder: Indicators based on administrative data will be available to all teams who have enrolled to receive the team level HQO Primary Care Practice Report (PCPR) at the end of May 2016.  This report will contain data current to March 2015. We suggest teams begin the review of their PCPR data and the data dictionary before summer to prepare for D2D 4.0, which will be released in late September 2016.

    If you have any questions regarding D2D or the Data Dictionary contact your local QIDS Specialist or the QIDS Program staff via Carol Mulder.


  • HQO Requesting Feedback on Quality Standards

    Health Quality Ontario would like your input on Quality Standards for Ontario. These are concise set of easy-to-understand statements outlining the best care possible for patients with selected conditions (see below for more details).

    As part of the HQO’s provincial Primary Care Quality Advisory committee, AFHTO has already sent feedback on the general question of Quality Standards in primary care.  One of AFHTO’s key messages is that primary care patients tend not to be “condition-specific.”  They frequently have multiple complex issues.  Quality Standards for primary care would ideally consider the complexity of questions associated with managing multiple morbidities and focus on building relationships with patients, in addition to helping manage individual body parts.

    HQO is looking for feedback from individuals as well as organizations on draft Quality Standards on schizophrenia, major depression and on the behavioural symptoms of people living with dementia. You can review these Quality Standards and send comments directly to HQO. Some questions you might want to consider are:

    • How helpful would these Quality Standards be in trying to manage YOUR patients?
    • How would information about your performance on these Quality Standards help you make sense of other data you are already tracking regarding your performance?
    • In general, how would Quality Standards help you focus your efforts to improve?


  • Clinical consultation process for Strategic D2D indicators

    D2D 4.0: Follow-Up after Hospitalization and Support for Tracking Phone Encounters

    The membership vote is in, and the Follow-Up after hospitalization Indicator has been recommended for inclusion in D2D 4.0 as new indicator with the following definition: %  of patients for whom timely (within 48 hours) discharge notification was received (any condition) and had a follow up (by any mode, any clinician) within 7 days of discharge.

    As noted below, follow-up can be done remotely — e.g., by phone — and by any clinician on the team. These tips will help you support your team in recording phone encounters in your EMR.

    May 12, 2016

    7-Day Follow-Up: Evidence of Impact

    Finally! Evidence about the impact of primary care follow-up after hospitalization!  Recent analysis is showing that follow-up by primary care physician within 7 days of discharge from hospital is associated with 68 fewer readmissions per 1000 patients.  This analysis still only considers in-person visits to physicians (ie visits for which a claim was submitted by the physician).  However, it is a welcome contribution to the questions AFHTO members have been asking: “what is the evidence that follow-up within 7 days makes a difference?”.

    See analyses below for more details.


    March 17, 2016

    Update to 7-Day Follow-Up Indicator

    Teams reviewing their 7-day follow-up rate information on the Health Data Branch portal recently may have noticed a surprising 10-20% drop from previous years.  AFHTO has learned that the definition of this indicator has changed.  It is now based on selected HBAM Inpatient Grouper (HIG) conditions instead of Case Mix Groups (CMGs).  Said differently, the indicator is now based on a slightly different group of disease conditions and patients.  For example, some patients with heart attacks are now included in the denominator.  See below or visit https://secure.cihi.ca/free_products/Assigning-HIG-Weights-2014-EN.pdf for more information about HIGs and CMGs.

    “The HIG methodology uses Case Mix Group (CMG+) grouping methodology output and additional clinical information to assign each case to an HIG [….] In most cases, the HIG groups are identical to the CMG+ groups. As mentioned above, 88% of cases are assigned to HIG groups that are the same as the CMG+ group.”[i]

    To address this aspect of their QIP, teams are encouraged to consider the work that AFHTO is doing on behalf of members to advocate for a better way to measure follow-up after hospitalization.  Briefly, there is solid consensus among AFHTO members on the following:

    • Follow-up after hospitalization is an important role for primary care providers.
    • Follow-up can be done by any clinician, not just physicians.
    • Follow-up can be done remotely (g., by phone), not just through in-person visits.

    AFHTO is working to develop an alternative measure for follow-up which takes the wisdom of the field into account.  Substantial progress has already been made in developing and disseminating queries to track phone encounters in the EMR.  Work also continues to increase access of primary care teams to timely, useful hospitalization data.  A revised, EMR-based indicator is being proposed for D2D 4.0 (tentatively scheduled for fall 2016).

    Early input from MOHLTC suggests there may be openness to this revised indicator, partly because it is closer to what clinicians believe matters.  There is also a sense that an EMR-based definition would reduce the risk of masking improvements in team-based follow-up, as would happen with a physician-billing-based indicator.

    Members are encouraged to consider referencing these developments in the context of their QIP reports on follow-up.

    [i] Canadian Institute for Health Information, 2011. Assigning HIG Weights and ELOS Values to Ontario Inpatient DAD Cases 2011, Version 1.0. Page 5. < https://secure.cihi.ca/free_products/Technical_Document_en.pdf>


    February 1, 2016

    Results of Clinical Consultations for Strategic Indicators

    There is a need to increase the capacity of D2D to reflect team-based care.  Among the indicators being considered to help with this are avoidable ED visits and follow-up after hospitalizations.  In addition to being clinically meaningful, these two indicators are also of strategic interest, given the increasing attention of MOHLTC to these measures.  However, the existing indicators for these outcomes do not meet the needs of AFHTO members.

    Physician participation in quality improvement and performance measurement is critical.  AFHTO undertook a clinical consultation process to seek input from clinicians; this will be incorporated into decision-making about the definition of strategic D2D indicators in time for the release of the next iteration of the report, tentatively planned for January 2016.

    Read on to learn how input from clinicians was sought Please contact Carol Mulder for more information.


    October 16, 2015

    Develop Draft 1 of Proposal

    Develop initial proposals: For each of the indicators, AFHTO staff will compile available background information from sources such as published literature, advice from external experts and peer organizations, AFHTO member survey results, QIDSS guidance and other member input via informal channels.  Based on this, initial proposals for the definition of each indicator will be developed.

    Review of initial proposals by clinical working group: A small number of clinician volunteers will review the initial proposals and provide clinical insight to refine them and identify any further outstanding questions or risks to be explored.

    Additional targeted consultation with clinicians: The proposed definitions for the strategic indicators will be further refined based on input emerging from local team-based conversations (eg via QI committees, physician group meetings etc) and discussions at other clinical forums such as the D2D Advisory Panel, the Physician Leadership Council and IHP CoPs etc.

    Feasibility assessment: Ongoing throughout will be assessments of feasibility (ie access to data) for the various iterations of the indicators that emerge from the clinical consultation.  This will primarily be through consultation with QIDSS and EMR CoPs and will be managed through the EMR Data Management sub-committee.

    Draft 2 of Proposal

    Second draft of proposals: AFHTO staff will develop a second draft of proposals, based on the broad-ranging consultation above, including commentary on the feasibility of the draft proposals.

    Review of second draft by clinical working group: The clinical working group will consider revised proposals and responses to their suggestions for risk management (identified at initial meeting).  Changes will be incorporated into the proposals for consideration of the membership.

    Draft 3 of proposal: Indicators Working Group

    Membership-wide vote:  All AFHTO members will be invited to vote on the proposals emerging from the consultation process described above.

    Review of results of clinical consultation by Indicators Working Group: The results of the membership-wide vote will be considered along with recommendations from the EMR DM sub-committee regarding feasibility in preparation of a final draft of the definitions for the strategic indicators.

    Final Draft: Indictors Working Group

    Sign off by Clinical working group: The Clinical working group will consider the final versions of the definitions for the indicators (prepared by the Indicators Working Group based on consultation to date).  They will comment on whether the consultation has been successful in generating a clinically useful definition for each indicator.

    Membership wide announcement

    Recommendations for implementation of strategic indicators: The QIDS steering committee will consider the recommendations of the Indicators Working Group and commentary from the Clinical working group to make decisions about incorporating each of the strategic indicators in subsequent iterations of D2D.

    Board consideration of strategic indicators: The Board of AFHTO will consider recommendations from the QIDS steering committee and make decisions about the indicators prior to release of D2D 3.0, planned for Jan 2016.

    Membership-wide announcement: The definitions for the strategic indicators will be released at the launch of D2D 3.0 to give members as much time as possible to incorporate these indicators into the subsequent iteration of D2D.


    August 27, 2015

    The following describes the process and progress to date with consultation with clinicians about the definition of strategic D2D indicators in time for the release of D2D 3.0, tentatively planned for Jan 2016.  Please contact Carol Mulder for more information about the process and focus of the consultation.

    See below for:

    • Background information on the strategic indicators
    • Process & Timeline for the consultation
    • Learnings to date
    • How to join the conversation

    Background information on the strategic indicators

    • Emergency department (ED) visits: Ontario (and Canada) have high ED visit rates.  A large part of the rationale for investment in primary care, and primary care teams in particular, is to reduce ED visits.  In addition, the MOHLTC has signalled an intent to include ED visits as an indicator to monitor primary care performance in the future.  There are several approaches to tracking unnecessary Emergency Department visits including “ED visits Best Managed Elsewhere”, “less urgent ED visits – CTAS 4-5” and patient self-report of ED visits.  For various reasons, none of these definitions are believed to generate a useful estimate of the number of patients for whom primary care providers could provide an alternative to ED care.
    • Follow-up after hospitalization (exploratory in D2D 2.0): Follow-up of patients by primary care providers after hospital or ER department visits is a valuable way to improve patient outcomes.  However, lack of access to data in primary care settings about hospital events makes it difficult to both measure and improve follow-up care.  The available data is currently too old and excludes too many important concepts (i.e. follow-up by non-physicians, follow-up by phone etc.) to be useful to support measurement and improvement by local primary care providers.
    • Time spent delivering primary care (capacity): A measure of human resource complement in the team allows estimation of capacity of team to serve a population of patients.  Access to comprehensive primary care for ALL Ontarians remains a priority of AFHTO and increasingly so for the MOHLTC.  A measure of the human resources available and the extent to which they are reaching their capacity to deliver care is needed to inform decisions related to extending the reach of health teams beyond their current rosters in a way that optimizes efficiency and avoids staff burnout.

    Process

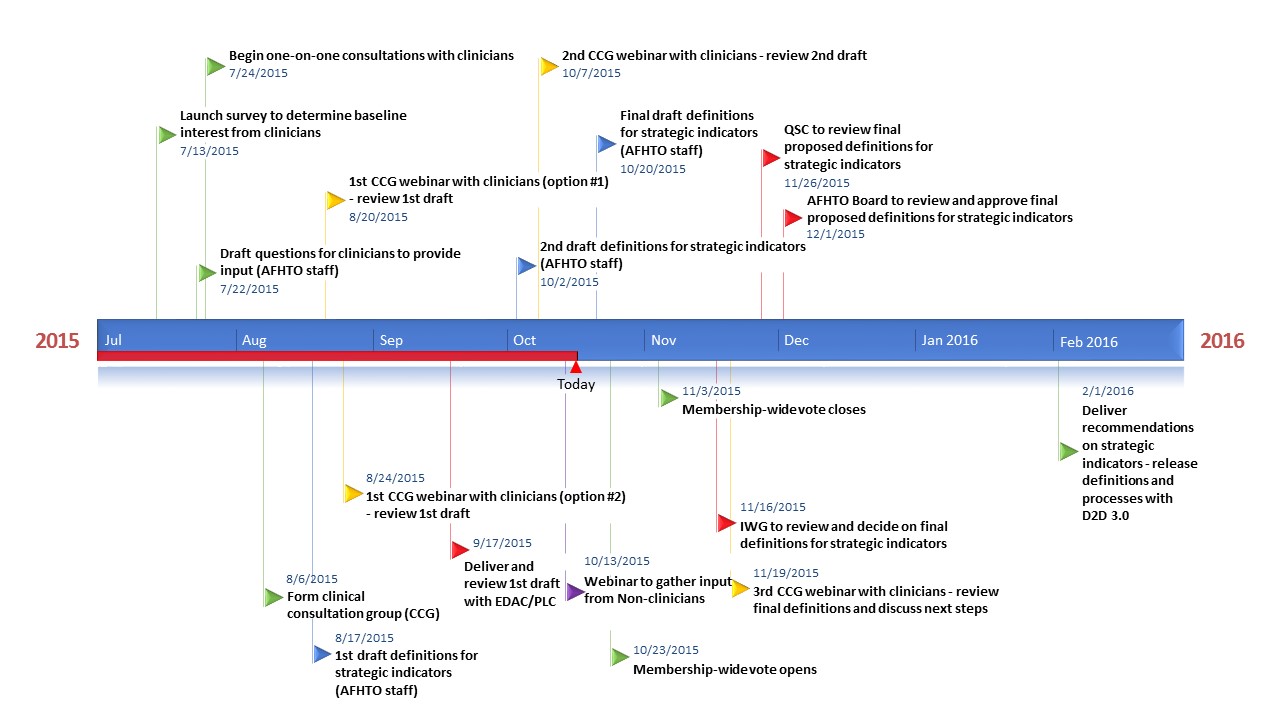
    See Figure 1 for the timeline of the consultation process. Please note that all dates are approximate, with the exception of the red flags indicating meetings that have already been confirmed. For more details about each draft click here.

    Timeline CCG work 2015-10-16

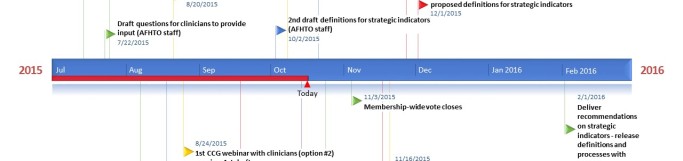
    Figure 1: Timeline for consultation on strategic D2D indicators

    Last updated Oct 16, 2015

    Learnings to date

    1)   ED visits:

    • Purpose: help providers measure and thus reduce avoidable ED visits
    • Definition considerations:
      • Should include CTAS 4/5 visits and should focus on ‘avoidable’ visits.  However, no consensus on definition of avoidable yet
    • Outstanding information
      • Summary of the most common reasons/diagnoses for CTAS 4/5 visits
      • Possibility of sorting CTAS 4/5 visits according to time of day
      • Input from ED physicians regarding “avoidable”
      • Possibility of applying evidence based algorithm (the NY algorithm) to existing ED data to identify “avoidable” visits

    2)   Follow-up after hospitalization

    • Purpose: help providers measure and thus improve follow-up; reduce chance of people “falling through the cracks”
    • Definition considerations:
      • Should include multiple modes of follow-up (i.e. phone, home-visit etc. as well as in person office visit) by any clinician (i.e. not limited to physician) and probably center on common chronic conditions already the focus of the MOHLTC version of the indicator.
      • Timeframe should be evidence-based.
      • Denominator should exclude patients for whom hospitalization data was not communicated to primary care team.
    • Outstanding information
      • Strategies to more effectively communicate hospitalization data to primary care team
      • Technical process for consistently recording and extracting data about phone-based follow-up in EMRs

    3)   Time spent delivering primary care (capacity):

    • Purpose: document capacity of the clinical team to deliver primary care services for purposes of identifying appropriate patient volumes and supporting argument for recruitment and retention in primary care teams
    • Definition considerations
      • Include time spent by all clinicians (physicians and IHPs)
      • Include any and all activities related to the care of a specific patient including time spent seeing patients in person, phone/email communication, completing documentation/updating EMR
    • Outstanding information
      • Input from broader range of clinicians (consultation on this topic not as advanced as previous topics)
      • Approaches used in partner organizations (E.g. RNAO, AOHC, OCFP, others)

    Join the Conversations

    As illustrated in the timeline (see above), draft definitions and outstanding questions will be considered by the Executive Director Advisory Council (EDAC) and Physician Leadership Council (PLC) joint meeting on September 17, 2015. We would like to know your thoughts about what these definitions and considerations should be.

    If you are a clinician:

    Please let us know which one(s) of the following activities you might be able to undertake

    1. Provide input through a 10-15 minute “corner consult” by telephone with Carol Mulder, provincial lead of the QIDS program at AFHTO
    2. Discuss the above information with your QI committee or physician group and e-mail responses, questions, or suggestions to Carol Mulder.
    3. Participate in a working group meeting via teleconference with other interested clinicians (2-3 times between now and December 2015).

    Please send your responses to Carol Mulder, Provincial Lead for the QIDS program

    If you are not a clinician:

    Option 1: help gather input from clinicians
    Please let us know which one(s) of the following activities you might be able to undertake to get more input from clinicians within your teams

    1. I will forward contact information for one or more clinicians who might be interested in providing input on these indicators
    2. I will discuss the aforementioned considerations with my QI committee and send in notes of the discussion
    3. I will discuss the aforementioned considerations with my physician group(s) and send in notes of the discussion

    Option 2: provide your own input

    1. Talk to an ED who will be attending the EDAC/PLC meeting on September 17, 2015 and ask them to share your input with the group
    2. Participate in a discussion with other non-clinicians via webinar (late September – TBA)
    3. Provide input on the aforementioned considerations via e-mail

    Please send your responses to Carol Mulder, Provincial Lead for the QIDS program.

  • Patient Stories Wanted for HQO 2016 Annual Report

    Health Quality Ontario is seeking patient stories for inclusion in Measuring Up 2016, their annual report. This would be a great opportunity to profile your team’s work for key stakeholders through your patients’ experiences.

    Areas of interest include:

    • A patient with 1 or more risk behaviours (smoking, obesity, not enough fruits/vegetables)
    • A patient with multiple chronic conditions
    • A patient without prescription medication insurance but who needs medication to treat or prevent a health condition.
    • A patient who has experienced frustration with getting a same day/next day, or after hours, appointment with family doctor or other primary care provider, resulting in having to visit emergency dept. and/or walk-in clinic.

    Patient stories from communities across Ontario are welcome and interviews would need to be completed by mid-July. Any team who’d like to contribute can contact:

    Heather Angus-Lee
    Writer & Editor, Health System Performance
    Health Quality Ontario
    Heather.Angus-Lee@hqontario.ca
    905-308-0038

  • Webinar – Introducing the Electronic Patient Reported Outcomes (ePRO) Tool.

    Researchers from the Bridgepoint Collaboratory for Research and Innovation presented a webinar to introduce the Electronic Patient Reported Outcomes (ePRO) Tool to AFHTO members. This tool allows patients and providers to set outcome goals together, after which patients are able to track and report on their progress towards these goals using an app on their mobile device (tablet or phone). The researchers are hoping to recruit 22 sites for a clinical trial scheduled to begin in January 2017. Drs. Carolyn Steele-Gray, Walter Wodchis, and Pauline Boeckxstaens presented the tool and some information about the planned clinical trial. Slides from the webinar  and a video recording of the webinar (see below – length 1:03:53) can help you determine whether your team might be suited to participate in the trial.  More information about the tool, including some short videos, can be found here. If you have any questions, please contact catherine.macdonald@afhto.ca.

    About the project:

    Patient reported outcomes (PRO) are increasingly recognized as a major indicator of quality in health care. PROs can provide insight into the impact of treatments and interventions on a person’s health that go beyond traditional provider chosen outcomes. They may include vital signs, disease specific symptoms, functionality, pain, general well-being, among other measures in high risk patients. Patients themselves have identified the health of their informal caregiver (often the spouse of a senior patient) to be a significant metric in terms of assessing whether their own current treatment/management strategy was effective.

  • Primary care quality improvement: Is data the future?

    Healthy Debate article published May 19, 2016. Article in full pasted below.
    Authors: Vanessa Milne, Christopher Doig & Jill Konkin

    Alberta’s Chinook Primary Care Network serves more than 170,000 residents, bringing together health-care groups that include 140 physicians, as well as nurse practitioners and dietitians. But it also includes some more surprising positions: a director of evaluation, three senior quality analysts, and an information management lead.

    What kind of group needs five full-time data analysts? One that believes in the importance of regular feedback and metrics. The primary care network (PCN) has been measuring performance indicators for a decade, and it offers customized reports on demand to its physician leadership board as well as individual doctors.

    For example, knowing that diabetes increases the risk of cardiovascular disease, they often look at how many diabetes patients are on a statin. They further break that information down by age, sex, BMI and tobacco use. And they can track how often diabetes patients are seeing their care providers – including who hasn’t been seen within the past year, and might need to be called in for an appointment. (Click here to see a sample report.)

    “One doctor who had just taken over another doctor’s panel of patients asked me, ‘Proportionally, how many of my diabetic patients are on a statin?’ I said about 40%, and he was really alarmed,” says Charles Cook, director of evaluation at the PCN. “This allows us to provide that bird’s eye view.”

    This kind of data-driven analysis is now available to family doctors in both Ontario and Alberta province-wide. Known as audit and feedback, it offers doctors – and teams of doctors – the chance to have their information analyzed and submitted to them as a report. (Such reports have also been used in Canadian hospitals, but this article focuses on its use in primary care teams.)

    Audit and feedback compares their performance on key indicators, like the use of lab tests or of cancer screening against those of other practitioners in the region. For now, those reports are most often presented quarterly or once a year. But we’re moving towards faster feedback. Some health care workers in the Chinook network can access current reports on a private website, which will evolve into a continually updating hub – like a Google Analytics page for clinical care. “Our plan over the next couple years is to get it as close to real time as we can,” says Cook.

    The idea of audits doesn’t resonate with everyone, however. A 2011 mixed-methods study looked at how seven Ontario family health teams responded to having their performance measured. It found that, on the whole, physicians were supportive of the idea, but some also had concerns. “It can be threatening to someone who has done stuff the same way for 25 years, to be told that people can measure this now and they can tell you whether you are effective or not, and their records are completely accessible for analysis,” one physician told the researchers.

    “Some doctors who haven’t used this before are anxious about having people looking at their data – or are even anxious about looking at their own data,” echoes Lara Cooke, associate dean of Continuing Medical Education and Professional Development at the University of Calgary and co-leader of the Alberta Physician Learning Program. “It’s a culture shift.”

    The effectiveness of audits also varies greatly with the quality of implementation – with poorly executed audit and feedback having no impact at all on quality. And of course, it’s not possible to measure everything that’s important. “There are limitations,” says Noah Ivers, a family physician and scientist focusing on quality in primary care. “But there is also incredible potential.”

    Alberta and Ontario’s data-driven primary care improvements

    Audit and feedback systems are seen as a way to ensure more accountability and to shape continuing professional development. Worldwide, it has been tied to public accountability and physicians’ pay, but in Canada, many audit and feedback programs are framed as part of quality improvement and professional development, and therefore are voluntary and not publicly available.

    Alberta offers multiple audit and feedback programs, including the Physician Learning Program (PLP). The PLP is “basically thought of as a service to the members of the [Alberta Medical Association],” says Cooke. It offers tailored reports – a key component of successful audit and feedback, in addition to providing general reports. “Doctors or groups of doctors might come to us with questions about some specific clinical thing – how are we doing with management of condition X – and we sit down with them and figure out how to tailor the report to them,” she says.

    None of us is terribly good at knowing what our actual performance is…but the data tells the tale, and brings out the gaps.”

    Last year, they created 300 reports across the province, which combine charts and data with structured feedback, including looking at evidence-based guidelines and identifying barriers to success. In primary care, she says, they’ve often focused on Choosing Wisely recommendations, such as increasing the likelihood these recommendations are followed for cervical cancer screening. They follow up with another audit on the same data six months or a year later, so doctors can see their progress. And they’re working with other groups on a “dashboard” model that would update key figures in real time.

    Ontario also has a handful of organizations working on primary care audit and feedback, including Health Quality Ontario’s Primary Care Practice Reports. Since its launch in 2014, hundreds of doctors, Family Health Teams and Community Health Centres have volunteered to have their practice analyzed.


    Screen Shot 2016-05-18 at 8.54.02 PM

    An example of a chart from a Primary Care Practice Report. Click here to see a full sample report


    It compares the practice with other similar types of practices in the province, reporting on, for example, how many patients are up to date on cancer screening and diabetes management testing, or examines rates of emergency department visits.

    “For health care utilization data, [like ED visits and readmissions] we present risk-adjusted data to account for differences in the populations different practices are serving,” explains Anna Greenberg, vice president of health system performance at HQO. “On the other hand, we present raw, unadjusted data for cancer screening or diabetes management indicators, so that practices can understand the true rates of uptake.”

    HQO also offers tips for improvement and encourages doctors to set goals for themselves. The team is currently working with Ivers and the Ontario SPOR Support Unit to study the impact of these reports, but that information is not yet available.

    Physicians can get another report in a year’s time, though HQO is working towards providing faster results. “There’s a lot more data in primary care than there was when this started,”Greenberg says.

    Nonetheless, creating these reports isn’t easy, as accessing and analyzing the data can be labour intensive. There can be long turnaround times to get the information – typically, a year long in Ontario – and it can be time consuming to anonymize it. The data for the PCP reports comes from institutions like OHIP, the Ontario Cancer Registry and the Ontario Diabetes Database, while Alberta’s PLP pulls from sources like Alberta Health and Alberta Health Services.

    It’s difficult to get information on prescriptions for people under 65, and for other team members like nurse practitioners. And some of the data simply isn’t appropriate. “It’s not collected with this kind of work in mind,” explains Cooke. “Its purpose is for billing and data quality can be an issue. If [doctors] don’t know all the billing codes, and have some go-to ones…garbage in, garbage out.”

    The evidence behind its effectiveness

    So is it worth the effort? Audit and feedback has been analyzed for its effect in both primary care and for specialists. Audit and feedback is generally effective, “but there’s a huge variation in that effectiveness,” says Ivers, author of the Cochrane Review that investigated its impact. It looked at 140 studies and found that audit and feedback “generally leads to small but potentially important improvements” in performance, with a median of 4% improvement in the outcomes the feedback was trying to address. But one quarter of the interventions had larger effects (up to 16% absolute improvement), and one quarter had no effect.

    The review found audit and feedback was more effective when it was given both verbally and in writing by a supervisor or colleague, when it included an action plan and targets, and when it was offered more than once. It also worked best on health care workers who had been doing worse than average on the outcomes being measured.

    Well aware of the importance of execution, the Primary Care Practice Reports are working with the Canadian Institutes of Health Research (CIHR) to modify their reports and test their effectiveness. A recent ICES report by Richard Glazier points to key evidence-backed ways that Ontario’s reports can improve, including adding both explicit targets and tools that help physicians create an action plan.

    “We kind of see this work as a bit of a laboratory and a learning system; we work with researchers to continually look at how we optimize the report,” says Greenberg.

    Ivers also cautions against “pretending that all the things that are important are readily measurable. We need to try to measure what matters, and right now we’re frequently measuring what’s easy to measure,” he says. For example, what patients feel is important – including wait time to see their doctors, and whether they had enough time with them at their appointment – is often not available in the data that doctors collect. (Some programs, like the Association of Family Health Teams of Ontario’s Data to Decisions feedback, does incorporate patient experience data, however.)

    But despite its limitations, audit and feedback is superior to other professional development measures, says Ivers. “We have evidence that humans tend to seek continuing learning in things they know a lot about and are already doing good at. It kind of defeats the whole purpose,” he says. “[Using data] to drive continuing professional development means it’s about what our patients and communities need, not what we’re interested in.”